Validation Report - TUD-5d GRACE Level-2A/B LGD-derived product
Dataset: TUD-L2B-5dayEWH_2002_2016.nc
Version: v1.0exp
Author:
Michal Cuadrat-Grzybowski, PhD candidate
Email: M.Cuadrat-Grzybowski-1@tudelft.nl
Institution: Delft University of Technology, Space Engineering Department.
Date:
2025-04-19
Licenses:
Dataset License: Creative Commons Attribution-ShareAlike 4.0 International (CC BY-SA 4.0),
Software License: Apache License 2.0,
Images License: Creative Commons Attribution-ShareAlike 4.0 International (CC BY-SA 4.0).
Summary
This validation report assesses the quality and consistency of the high-frequency GRACE-derived product TUD-L2B-5dayEWH_2002_2016.nc (version: v1.0exp).
The following sections present visual inspections and core diagnostic results.
Each figure highlights a key aspect of the validation process, including spatial patterns, temporal consistency, and noise characteristics.
Specifically, the figures include:
- Output examples: (1) showing the 3 flooding peaks during the 2007 floods in Bangladesh. (2) A GIF file is presented to illustrate the time dependency and continuity of the models.
- Output example quality metrics analysis.
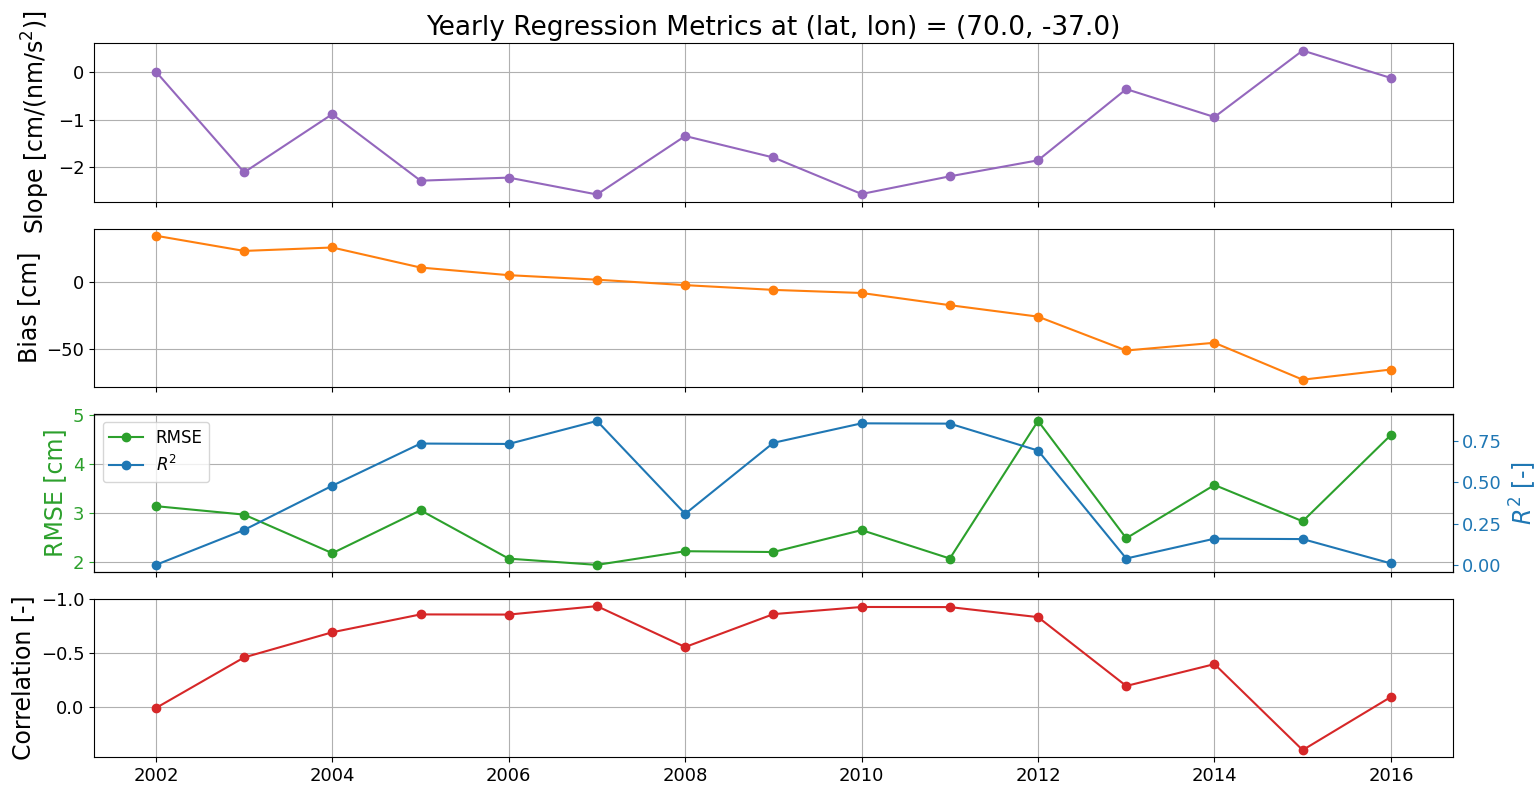
- Least-squares estimates of yearly scaling and bias. Recall the model: EWH [cm] = S [cm/(nm/s²)] × LGD [nm/s²] + Bias [cm]. Negative scaling factors are expected, since negative LGDs correspond to positive mass anomalies relative to the mean field.
- Correlation between the high-frequency LGD and the ITSG-Grace2018 daily solutions. Given that negative LGDs indicate positive mass changes, correlations closer to -1 indicate stronger agreement.
- p-values associated with the correlations, indicating statistical significance. Values below 0.05 suggest that the observed (anti-)correlations are unlikely due to chance.
- Linear regression metrics, including R² and RMSE, to quantify the fit quality across the datasets.
Beware that the RMSE is computed using the yearly scaling and bias values and not the improved 5d linearly interpolated version. These are therefore conservative estimates.
Issues Observed
-
Local artefacts from the monthly geo-fits or 5-day post-fit residuals, likely due to accelerometer and initial state vector mis-modellings.
-
Polar regions preserve correct month-to-month temporal behaviour, but 5-day solutions are highly noisy — potentially due to:
- Sub-monthly geophysical signals being smaller than background model errors, and/or
- Higher sampling density at the poles.
Bias values are particularly significant in these regions.
-
RMSE tends to increase during years of orbital resonances or repeat ground tracks, such as 2004, 2009, and 2015.
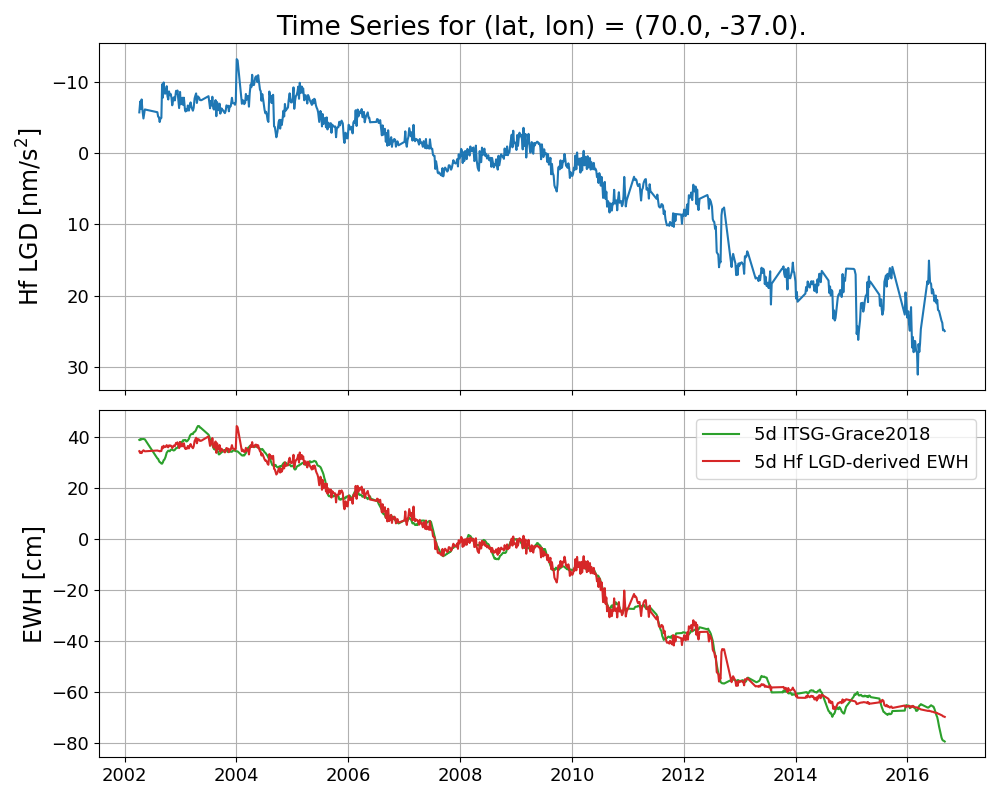
General overview (Greenland)
Times-series of quality metrics (Greenland)
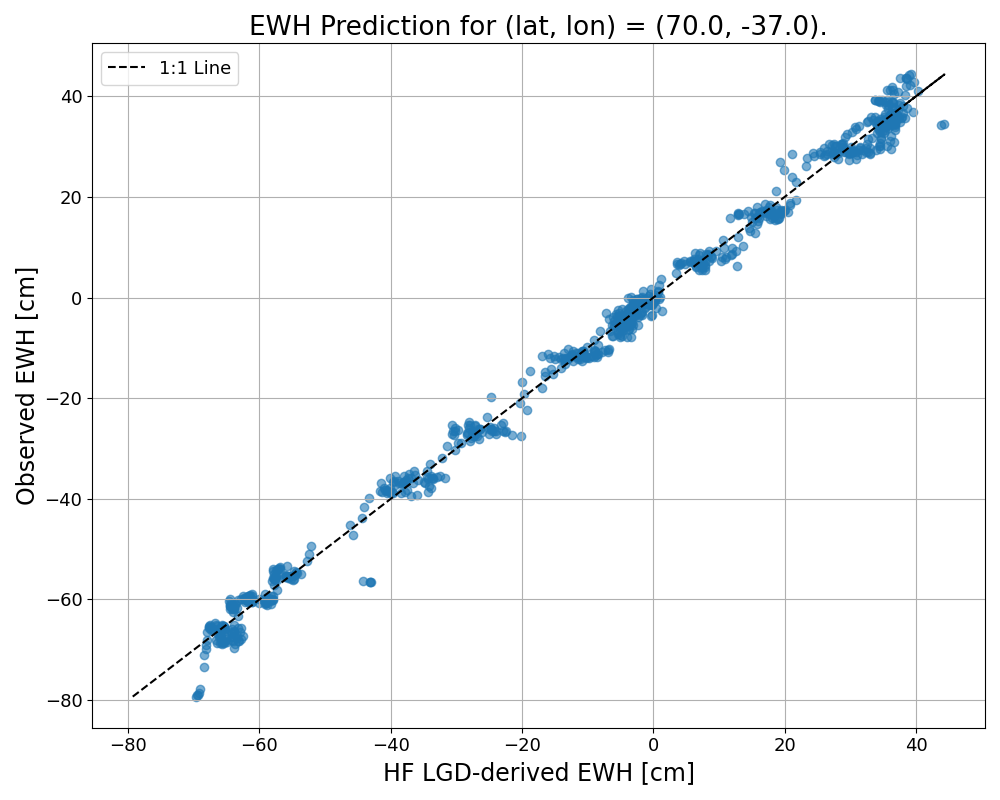
ITSG-Grace2018 vs. final EWH (Greenland)
Example Outputs from the Model
- Point Scale:

- Region Scale:

- River Basin:

- Time Series (LGD ➝ EWH):

Quality Measures
-
General overview

-
Zoom on 2007 flooding peaks

-
Times-series of quality metrics

-
ITSG-Grace2018 vs. final EWH

📊 Results by Category and Year
Scale & Bias
2002

2003

2004

2005

2006

2007

2008

2009

2010

2011

2012

2013

2014

2015

2016

Correlation (LGD vs EWH)
2002

2003

2004

2005

2006

2007

2008

2009

2010

2011

2012

2013

2014

2015

2016

P-value
2002

2003

2004

2005

2006

2007

2008

2009

2010

2011

2012

2013

2014

2015

2016

Quality Metrics
2002

2003

2004

2005

2006

2007

2008

2009

2010

2011

2012

2013

2014

2015

2016

References
Kvas, A., Behzadpour, S., Ellmer, M., Klinger, B., Strasser, S., Zehentner, N., & Mayer‐Gürr, T. (2019).
ITSG‐Grace2018: Overview and evaluation of a new GRACE‐only gravity field time series.
Journal of Geophysical Research: Solid Earth, 124.
https://doi.org/10.1029/2019JB017415
Mayer-Gürr, T., Behzadpur, S., Ellmer, M., Kvas, A., Klinger, B., Strasser, S., & Zehentner, N. (2018).
ITSG-Grace2018 - Monthly, Daily and Static Gravity Field Solutions from GRACE.
GFZ Data Services.
http://doi.org/10.5880/ICGEM.2018.003
×
![]()